
This is an update to my January post on MongoDB Charts. The good news is that MongoDB Charts is now out of beta, making it easier than ever for developers to embed data visualizations into their applications.
I received an email invitation earlier in the week to register for an online webinar entitled Get the Best of Geo Data with MongoDB Atlas and MongoDB Charts. The webinar was hosted by MongoDB developer advocate Ken Alger.
What I learned:
There are 2 options to enable embedding of charts into your web applications:
-
Verified Signature Required - This enables strict control over who can embed your charts.
-
Unauthenticated Access - This is a much more simple, but less secure method to embedding charts.
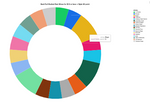
I decided to sample the Verified Signature Required method by embeddding my Best Full Bodied Wines for $12 or less chart into a simple Node.js application (My Repo), which proved to be delightfully simple and easy to implement.
If you are interested in learning more about MongoDB Charts, here are some helpful links to help you on your way:


Comments